and weather events
We have received some of his more recent rainfall data and present his summaries below. If this information is useful, he has some years of historic data that we may include as downloadable .pdf files.
Low Creoch is 25m above sea level, on the eastern side of the Fleet Valley with a SW aspect.
|
|
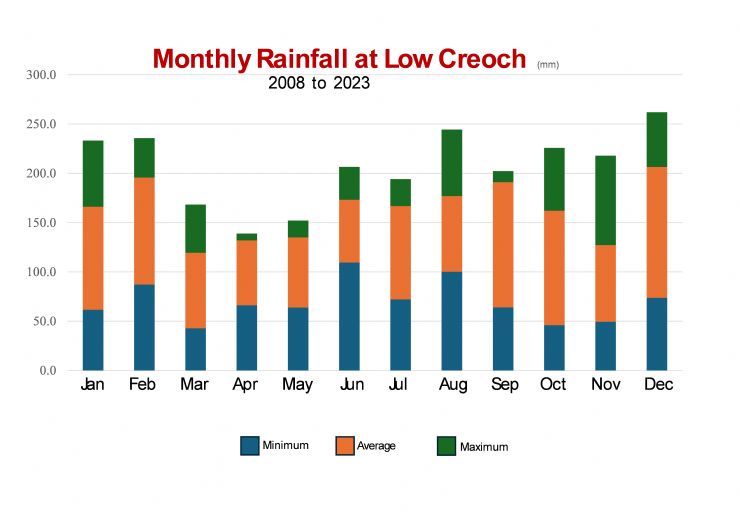
For each calendar month between 2006 and 2023 we have obtained daily rainfall at Low Creoch. Each month has a total rainfall. So for each month we have 18 total monthly rainfall numbers. In the chart on the left, the top of the blue bar shows the minimum monthly rainfall over the 18 separate months. The top of the orange bar indicates the average monthly rainfall from the same 18 figures. The top of the green band shows the maximum monthly rainfall over the 18 year period. |
2026 : Rainfall
| month | mm rain | dry days | wettest | mm | Notes |
| Jan | 181.3 | 3 | 27th | 40.7 | Rained nearly every day. More 'sleety' snow than in whole of 2025. There were 3 days in the last week of January which had a wee bit of wet slushy snow. Wettest weekend was 10th-11th with 28.4 & 23.1mm. |
| Feb | |||||
| Mar | |||||
| Apr | |||||
| May | |||||
| Jun | |||||
| Jul | |||||
| Aug | |||||
| Sep | |||||
| Oct | |||||
| Nov | |||||
| Dec | |||||
| Totals |
2025 : Rainfall
| month | mm rain | dry days | wettest | mm | Notes |
| Jan | 134.1 | 10 | 25th | 25.5 | Storm Eowyn hit during 24th & 25th. Trees & power lines down in Fleet Valley. Temperatures got down to -9, but didn't last for long. Low Creoch was without power for 3 days. |
| Feb | 89.4 | 14 | 22nd | 27.7 | Three quarters of monthly rain fell between 19th & 22nd, so felt a nice month. |
| Mar | 68.8 | 17 | 5th / 6th | 24.6 | 13 dry days in a row. 5 more days with <0.5mm. One of the driest March's John has recorded. A dry and pleasant month. |
| Apr | 37.8 | 18 | 18th | 12.3 | 4 more days with < 0.2mm. |
| May | 97.0 | 22 | 28th | 39.5 | 81 dry days for year so far. Not uncommon to get 90 dry days in full year. Previous 8 months had below average rain. This month breaks the trend. |
| Jun | 113.9 | 5 | 9th | 22.5 | 2nd June had 21.8 mm. 10 days < 1mm. |
| Jul | 83.2 | 8 | 4th | 23.4 | Another 10 days of <0.5mm |
| Aug | 100.7 | 13 | 3rd | 23.2 | 7 days with <0.5mm rain, + much of the rainfall was overnight, so it felt like an enjoyable month. |
| Sep | 186.2 | 6 | 30th | 58.2 | Including the last 7 days of August, there were 28 wet days in a row, the longest continuous run of wet days this year so far. |
| Oct | 136.7 | 5 | 3rd | 20.8 | 6 days > 12.5mm + 9 days <0.5mm. Felt like a wet month, but probably only average or slightly above average. |
| Nov | 287.9 | 8 | 4th | 40.0 | 13 wet days in a row from mid-October. On 3 occasions the daily rainfall was 38mm. The wettest day was in the middle of a run of 19 consecutive wet days. On 29th Nov there was snow on hill tops. River Fleet flooded on 1st Dec.- combination of rainfall and snow melt. |
| Dec | 168.4 | 10 | 7th | 22.8 | 5th Dec was 2nd wettest. Most dry days followed the winter solstice (21 Dec). |
| Totals | 1504.1 | 136 | 30th Sep | 58.2 | More dry days than in average year. November wettest month, April driest |
2024 : Rainfall
| month | mm rain | dry days | wettest | mm | Notes |
| Jan | 122.9 | 13 | 22nd | 31.0 | |
| Feb | 168.6 | 6 | 14th | 32.3 | Very wet period from late 13th to early 15th. 20th-21st also very wet. Rest of the month seemed to be better, felt like more than 6 dry days. |
| Mar | 179.2 | 3 | 13th | 28.1 | Pretty uninspiring month |
| Apr | 156.2 | 5 | 8th | 26.8 | Rained every day for 3 weeks. Not as wet as elsewhere. Seemed more than it actually was.... nocht spectacular. |
| May | 86.8 | 14 | 22nd | 28.7 | 6 consecutive dry days, 1st time since January. Otherwise nothing unusual. |
| Jun | 72.8 | 10 | 13th | 26.8 | 4 more days with no measureable rain + 4 more <0.5mm, but no good for haymaking, too wet at ground level |
| Jul | 103.2 | 8 | 18th | 28.3 | The 4 dry days were in the last 5 days of the month. 7 days had <0.5mm. A lot of 'nuisance' rain for farmers. |
| Aug | 311.1 | 3 | 4th | 88.1 | 9 days <0.5mm. 5 days with > 1 inch. The 88.1 plus 5.6 the next morning is 2nd wettest spell in nearly 30 years, and >300mm makes August one of the highest monthly rainfall amounts in nearly 30 years. |
| Sep | 60.6 | 15 | 25th | 19.2 | Driest month so far this year, unlike other parts of the UK. 4 more days < 0.5mm so felt much drier. Nearly 75% of days with no significant rain. Much needed driier weather given the lack of summer. |
| Oct | 133.0 | 8 | 27th | 39.2 | pretty much average rain and dry days. |
| Nov | 88.0 | 10 | 22nd | 46.9 | From 3am on 22nd to 2pm on 23rd 58.4mm rain was measured. As well as 10 dry days there were 11 more with <0.5mm. So it felt like a dry month. |
| Dec | 139.4 | 8 | 4th | 27.0 | A pretty standard early winter month. |
| Totals | 1621.8 | 103 |
2023 : Rainfall
| month | mm rain | dry days | wettest | mm | Notes |
| Jan | 205.1 | 5 | 12/13 | 42.3 | snow showers on 3 days (but only light) |
| Feb | 49.3 | 11 | 16th | 14.3 | a dry month - another 6 days of <0.5mm rain |
| Mar | 207.3 | 5 | 12th | 42.4 | 15th also wet (35.6mm). 15 days rain consecutive : 26th dry, otherwise 3 weeks of consective rain days. |
| Apr | 105.4 | 12 | 11th | 32.9 | Wetter than last 2 Aprils, but not exceptionally so. Definitely a colder month. |
| May | 46.3 | 24 | 7th | 31.3 | 3 days <0.05mm. 8th May had 7mm. Only 2 days of any real precipitation. Definitely a Mediterranean feel. |
| Jun | 74.1 | 18 | 19th | 19.2 | 19 consecutive dry days. But for 0.1 & 0.5mm rain on 20 & 21 May there would have been 31 consecutive dry days. Proper summer weather ! |
| Jul | 169.5 | 3 | 26th | 22.3 | Wetter than usual for July, but not as wet as elsewhere. |
| Aug | 67.5 | 6 | 18th | 23.8 | 10 other days of <0.5mm makes this a drier than average August |
| Sep | 174.8 | 8 | 15th | 27.4 | A lot wetter than August, but no rain after 12th September. |
| Oct | 118.1 | 5 | 6th | 29.5 | Decent month compared to others. Probably slighly less than average rain. |
| Nov | 136.3 | 10 | 12th | 37.6 | Nothing too extreme - "If November frosts can bear a duck there's naught to come but gutters and muck !" |
| Dec | 317.6 | 1 | 26th | 35.2 | 8th Dec was a close second with 34.2mm. 25 consecutive wet days. |
| Totals | 1671.3 | 108 | Just above average annual rainfall. Snow fell on 7 days of the year. |
| month | mm rain | dry days | wettest | mm | Notes |
| Jan | 75.2 | 13 | 7th | 29.6 | |
| Feb | 238.9 | 1 | 19th | 28.0 | |
| Mar | 74.8 | 16 | 2nd | 24.1 | fair bit drier than usual |
| Apr | 44.1 | 18 | 30th | 16.4 | 2 days had snow/hail showers. 1st 29 days had only 27.3 mm rain |
| May | 81.3 | 7 | 9th | 15.8 | old saying = the rain in May makes the hay |
| Jun | 63.1 | 13 | 27th | 15.9 | 8 days <1mm, so felt like a dry month |
| Jul | 43.8 | 12 | 23rd | 15.3 | 12 days <0.5mm so felt like another dry month |
| Aug | 107.8 | 15 | 1st | 34.8 | 6 more days 0.1 or 0.2mm, wettest since May, but not "wet". |
| Sep | 187.6 | 9 | 30th | 34.4 | 8 more days 0.1 or 0.2mm, felt like a decent month. |
| Oct | 186.2 | 1 | 25th | 27.1 | total just above ave. for month, but yearly total still below ave. |
| Nov | 222.0 | 3 | 7th | 35.8 | only 4 dry days from 20th September until end November |
| Dec | 151.5 | 10 | 29th | 48.3 | 29th Dec was the wettest day of the year |
| Totals | 1476.3 | 118 | Probably an average year of rainfall, despite feeling wetter than normal. |
| month | mm rain | dry days | wettest | mm | Notes |
| Jan | 145.3 | 11 | 13th | 27.3 | |
| Feb | 216.7 | 5 | 2nd-4th | 106.8 | |
| Mar | 109.0 | 10 | 9th | 19.5 | |
| Apr | 7.0 | 21 | 8th | 3.4 |
this is the driest month John has ever recorded, summer or winter
|
| May | 123.1 | 5 | 20th | 39.4 | some very localised showers, probably the coldest May for a while |
| Jun | 33.4 | 15 | 2nd | 11.9 | |
| Jul | 27.3 | 18 | 4th | 13.8 | 4 more days @ <0.1mm 13 consecutive dry days |
| Aug | 97.6 | 15 | 5th | 51.2 | |
| Sep | 92.3 | 8 | 26th | 22.7 | 6 more days @<0.1mm |
| Oct | 275.4 | 4 | 27th | 53.7 | wettest month of 2021 - more rain than Jul, Aug & Sep combined |
| Nov | 120.5 | 9 | 11th | 24.5 | no dry days in 2nd half of month |
| Dec | 169.7 | 6 | 10/11th | 26.7 | snow shower on 25th Dec |
| Totals | 1417.6 | 127 |
2020 : Rainfall
| month | mm rain | dry days | wettest | mm | Notes |
| Jan | 143.9 | 4 | 27th | 27.1 | |
| Feb | 275.3 | 2 | 19th | 45.7 | |
| Mar | 98.6 | 13 | 9th | 27.5 | dry spell started 20th March |
| Apr | 21.7 | 18 | 29th | 10.6 | 16 dry days in a row |
| May | 38.6 | 14 | 21st | 10.7 | |
| Jun | 142.3 | 10 | 27th | 36.1 | 27, 28 & 29 = 86.1mm |
| Jul | 221.4 | 2 | 22nd | 30.6 | |
| Aug | 176.9 | 11 | 25th | 40.1 | 26, 27 & 28 all wet c.60+ mm |
| Sep | 129.2 | 12 | 2nd | 63.5 | 2 mornings of frost. Only 3rd or 4th time daily mm > 60 in 25+ yrs. |
| Oct | 202.6 | 6 | 3rd | 34.2 | windy |
| Nov | 158.3 | 4 | 13th | 34.3 | only 10 dry days since 27th September |
| Dec | 198.0 | 8 | 12th | 25.5 | 16, 17 & 18th all over 20mm rain |
| Totals | 1806.8 | 104 | Wetter than average year. Snow on 5 days. | ||
| In September, Mark Hannay at Cardoness recorded 88.9 mm flash floods between Carsluith & Cardoness; |
Flooding

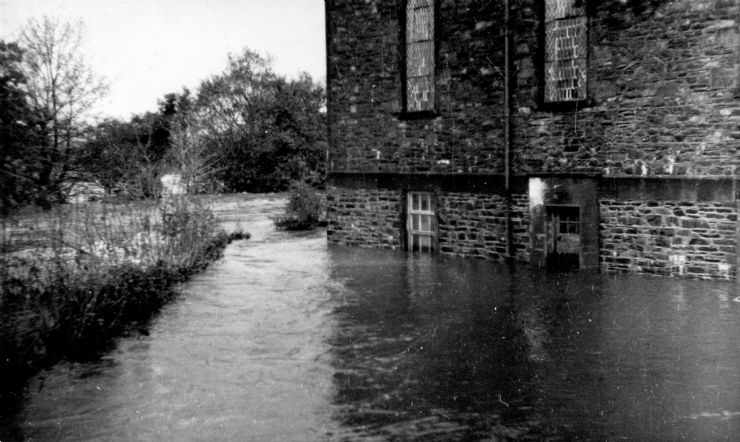
1954 : Friday 29th October at 10.30 am Rutherford Hall flood.

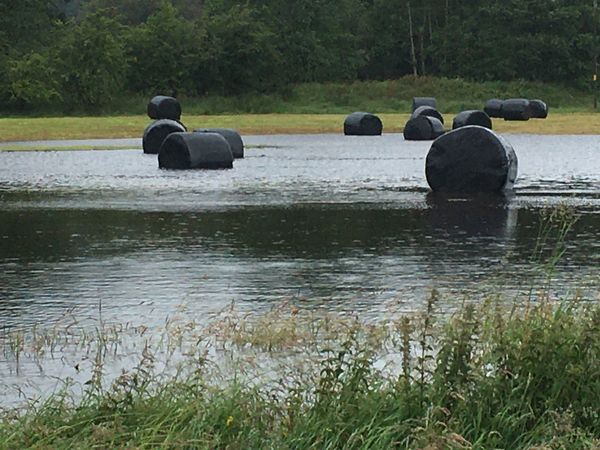
2019 June : Flooded field at Low Creoch.

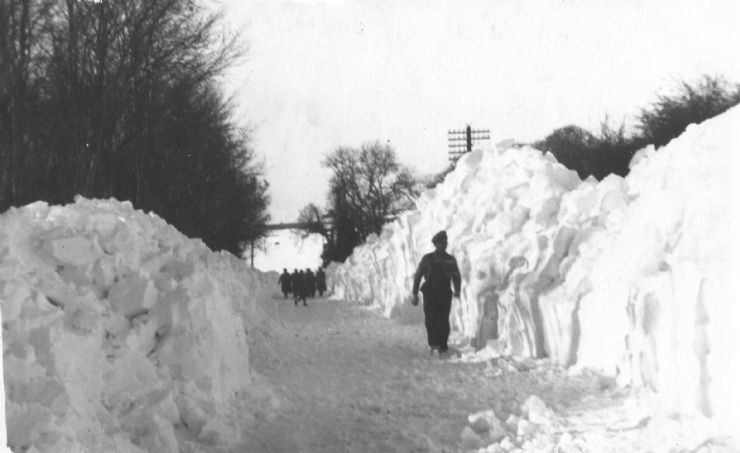
1947 March : Snow has been cleared to open up "The Cut".
2013 Click here to see some photos of the " Time Gatehouse was isolated " on 25th March 2013.

